Climate Insights is the heart of our business. It enables our clients to generate site-specific climate risk assessments for any physical asset (warehouse, factory, port, railway, office building, etc) at any location on the planet.
Climate Insights incorporates what we’ve learnt over twenty years of client engagement in conducting world-class physical risk assessments. We provide comprehensive , actionable and defensible climate information for decision making.
We offer a range of options for accessing Climate Insights data with packages depending on the number of assets.

Features
60+ metrics
Access our global database containing 60+ metrics across the atmosphere, land and ocean domains, with a focus on extremes of rainfall, temperature, wind, drought, flood and sea levels. Five Shared Socioeconomic Pathways (SSPs) are available for the 5th, 50th and 95th percentiles of climate model outputs.
Robust and transparent data
We work with a enormous volume of climate data and assess every model and data source before its application, enabling us to generate outputs that are robust, actionable, and defensible, with a devotion to transparency.
Global and local risk scoring and ranking
Our risk ranking takes world-leading physical climate risk information and applies a risk matrix approach to rank vulnerability and exposure of assets over time.
At the forefront of applied climate science
Our 20+ years of experience has equipped us to provide wise guidance to our clients. We use the techniques and methodologies of new climate analytics, and scan the industry for upcoming requirements and drivers that will impact on our clients’ interests. We regularly build new datasets and models that expand and enhance our Climate Insights Database.
Acute and slow-onset climate change
We provide climate change data for future scenarios (SSPs). These scenarios will reveal both slow-onset and acute risks. Our clients use this data to plan for challenges and opportunities. At ClimSystems, we have deep technical know-how and real world experience; we know the right level of analysis for our clients’ needs.
Tested and validated data
Over our twenty years of doing this, we’ve seen a lot of data quality issues out there in the data world, that’s why we independently test and validate all data we work with. We work closely with our clients to ensure we provide quality data that is the right fit for their purposes.
Flexible outputs
We provide ‘on point’ outputs in the form of text, graphs, tables and spreadsheets. Customise the output to suit your requirements. Climate Insights allows you to appreciate magnitudes of change across time horizons.
When you need it
With delivery built around your specific climate risks, we tailor the outputs based on how you want to use the data. We have a range of modes for accessing our data, from instant self-serve access to a short wait time for valet service.
Core Metrics
Access our global database containing 60+ metrics across the atmosphere, land and ocean domains, with a focus on extremes of rainfall, temperature, wind, drought, flood and sea levels. A full range of SSPs is available for the 5th, 50th and 95th percentiles of climate model outputs.

Climate Zone

Earthquake Risk

Tsunami Risk

Cyclone Risk

Monthly Mean Temperature

Monthly Precipation

Monthly Relative Humidity

Daily Extreme Precipation

Extreme Wind Speed

Heat Wave Days

Days above max temp

Cooling Degree Days

Annual Mean Sea Level Rise

Wildfire

Extreme Water Level

60+ Metrics
All Metrics
Atmosphere

- Maximum Temperature (Monthly)
- Mean Temperature (Monthly)
- Minimum Temperature (Monthly)
- Potential Evapotranspiration (Monthly)
- Relative Humidity (Monthly)
- Solar Radiation (Monthly)
- Humidex
- Wind Speed (Monthly)
- Extreme Wind Speed
- Extreme Precipitation
- Mean Precipitation (Monthly)
- Heating Degree Days
- Cooling Degree Days
- Heatwave Days
- Heatwave Frequency
- Cold Spell Duration Index
- Warm Spell Duration Index
- Maximum Temperature Higher Than Threshold (20°, 25°, 30°, 35°, 40°, 45° C)
- Minimum Temperature Days Lower Than 2° C
- Frost Days
- Apparent Temperature
- Modified Discomfort Index
- Normal Effective Temperature
- Temperature Humidity Index (THI) For Livestock
- Temperature Humidity Index (THI) For Physiology For Livestock
- Wind Chill Temperature
Land

- Soil Moisture (Monthly)
- Soil Temperature (Monthly)
- Forest Fire Danger Index
- Keetch Byram Drought Index
- Standardised Precipitation-Evapotranspiration Index (SPEI) Drought Probability (Over 1, 3, 6, 12 And 24 Months)
- Standardised Precipitation Index (SPI) Drought Probability (Over 1, 3, 6, 12 And 24 Months)
- Drought Probability
- Growing Degree Days (Temperature Above 4° C And 10° C)
- Rainfall derived flooding*
- Coastal Inundation*
*Available in specific locations
Ocean

- Mean Sea Level Rise
- Extreme Still High-Water Level at the Coast
- Marine Heatwave Days
- Marine Heatwave Frequency
- Sea Water Salinity (Monthly)
- Seawater Ph (Monthly)
- Sea Water Temperature (Monthly)
- Wave Height
Standardised Packages
SubscriptionFoundation
- For localised assets
- Global coverage
- Up to 100 locations
- Up to 15 core metrics
- Asset risk scores and ranking
- Account management and usage dashboards
- Output as data and charts
- Web-based access
- Flood zone variables (if available) for an additional fee
Self service option that’s good for organisations with internal climate and sustainability teams.
SubscriptionEnterprise
- For localised assets
- Global coverage
- Up to 5,000 locations
- up to 60+ metrics
- Flood zone variables included (where available)
- Asset risk scores and ranking
- Account management and usage dashboards
- Output data and charts
- Web-based access or receive data and charts through an API add-on
- Customised branding and report configuration
- Technical support included
- Multi-year subscription discount
Self-service option that’s good for assessing large numbers of assets or portfolios; for organisations with an internal climate and sustainability teams.
Valet
- For localised assets
- Global coverage
- Choose from 60+ metrics
- Unlimited locations
- Flood zone variables included (where available)
- Asset risk scores and ranking
- Data is pre-priced by unit or bulk
- ‘Data only’ or ‘Data and Reports’
- Tailored reports for different sectors and asset classes
- Output data and charts
- Outputs compliant with regulatory standards (e.g. TCFD, Green Star, Equator Principles)
- Customised branding
- PowerBI dashboard option
Good for organisations who would like data and reports produced for them.
Flexible Climate Data and Services
With access to extensive global data and metrics, ClimSystems creates fully customised packages to suit the scale and type of your assets (both localised or spatially dispersed). All levels of analysis are catered for, from high level screening to medium and deep-dives.
- Unlimited locations
- Up to 60+ metrics, global coverage
- Hazard risk scores and ranking
- Custom dashboards and business intelligence platforms
- Customised report configuration
- Portfolio screening based on aggregated granular data
- Medium and deep-dive climate risk assessments
- Gridded data
- Linear asset analysis
- Climate Value at Risk (VaR)
- Disruption to service and supply chains
Good for organisations that require a bespoke solution to understand climate risks to either a portfolio of assets or the climatology of a region. This option is also great for spatially dispersed assets such as railways, pipelines and roadways.
Reseller Licence
This licenses your organisation to use Climate Insights data in your value-added offerings. Data can be delivered as data files or dynamically accessed through an API.
Good for technology and software companies, consultants who use our data as part of a solution for their clients.
Preview
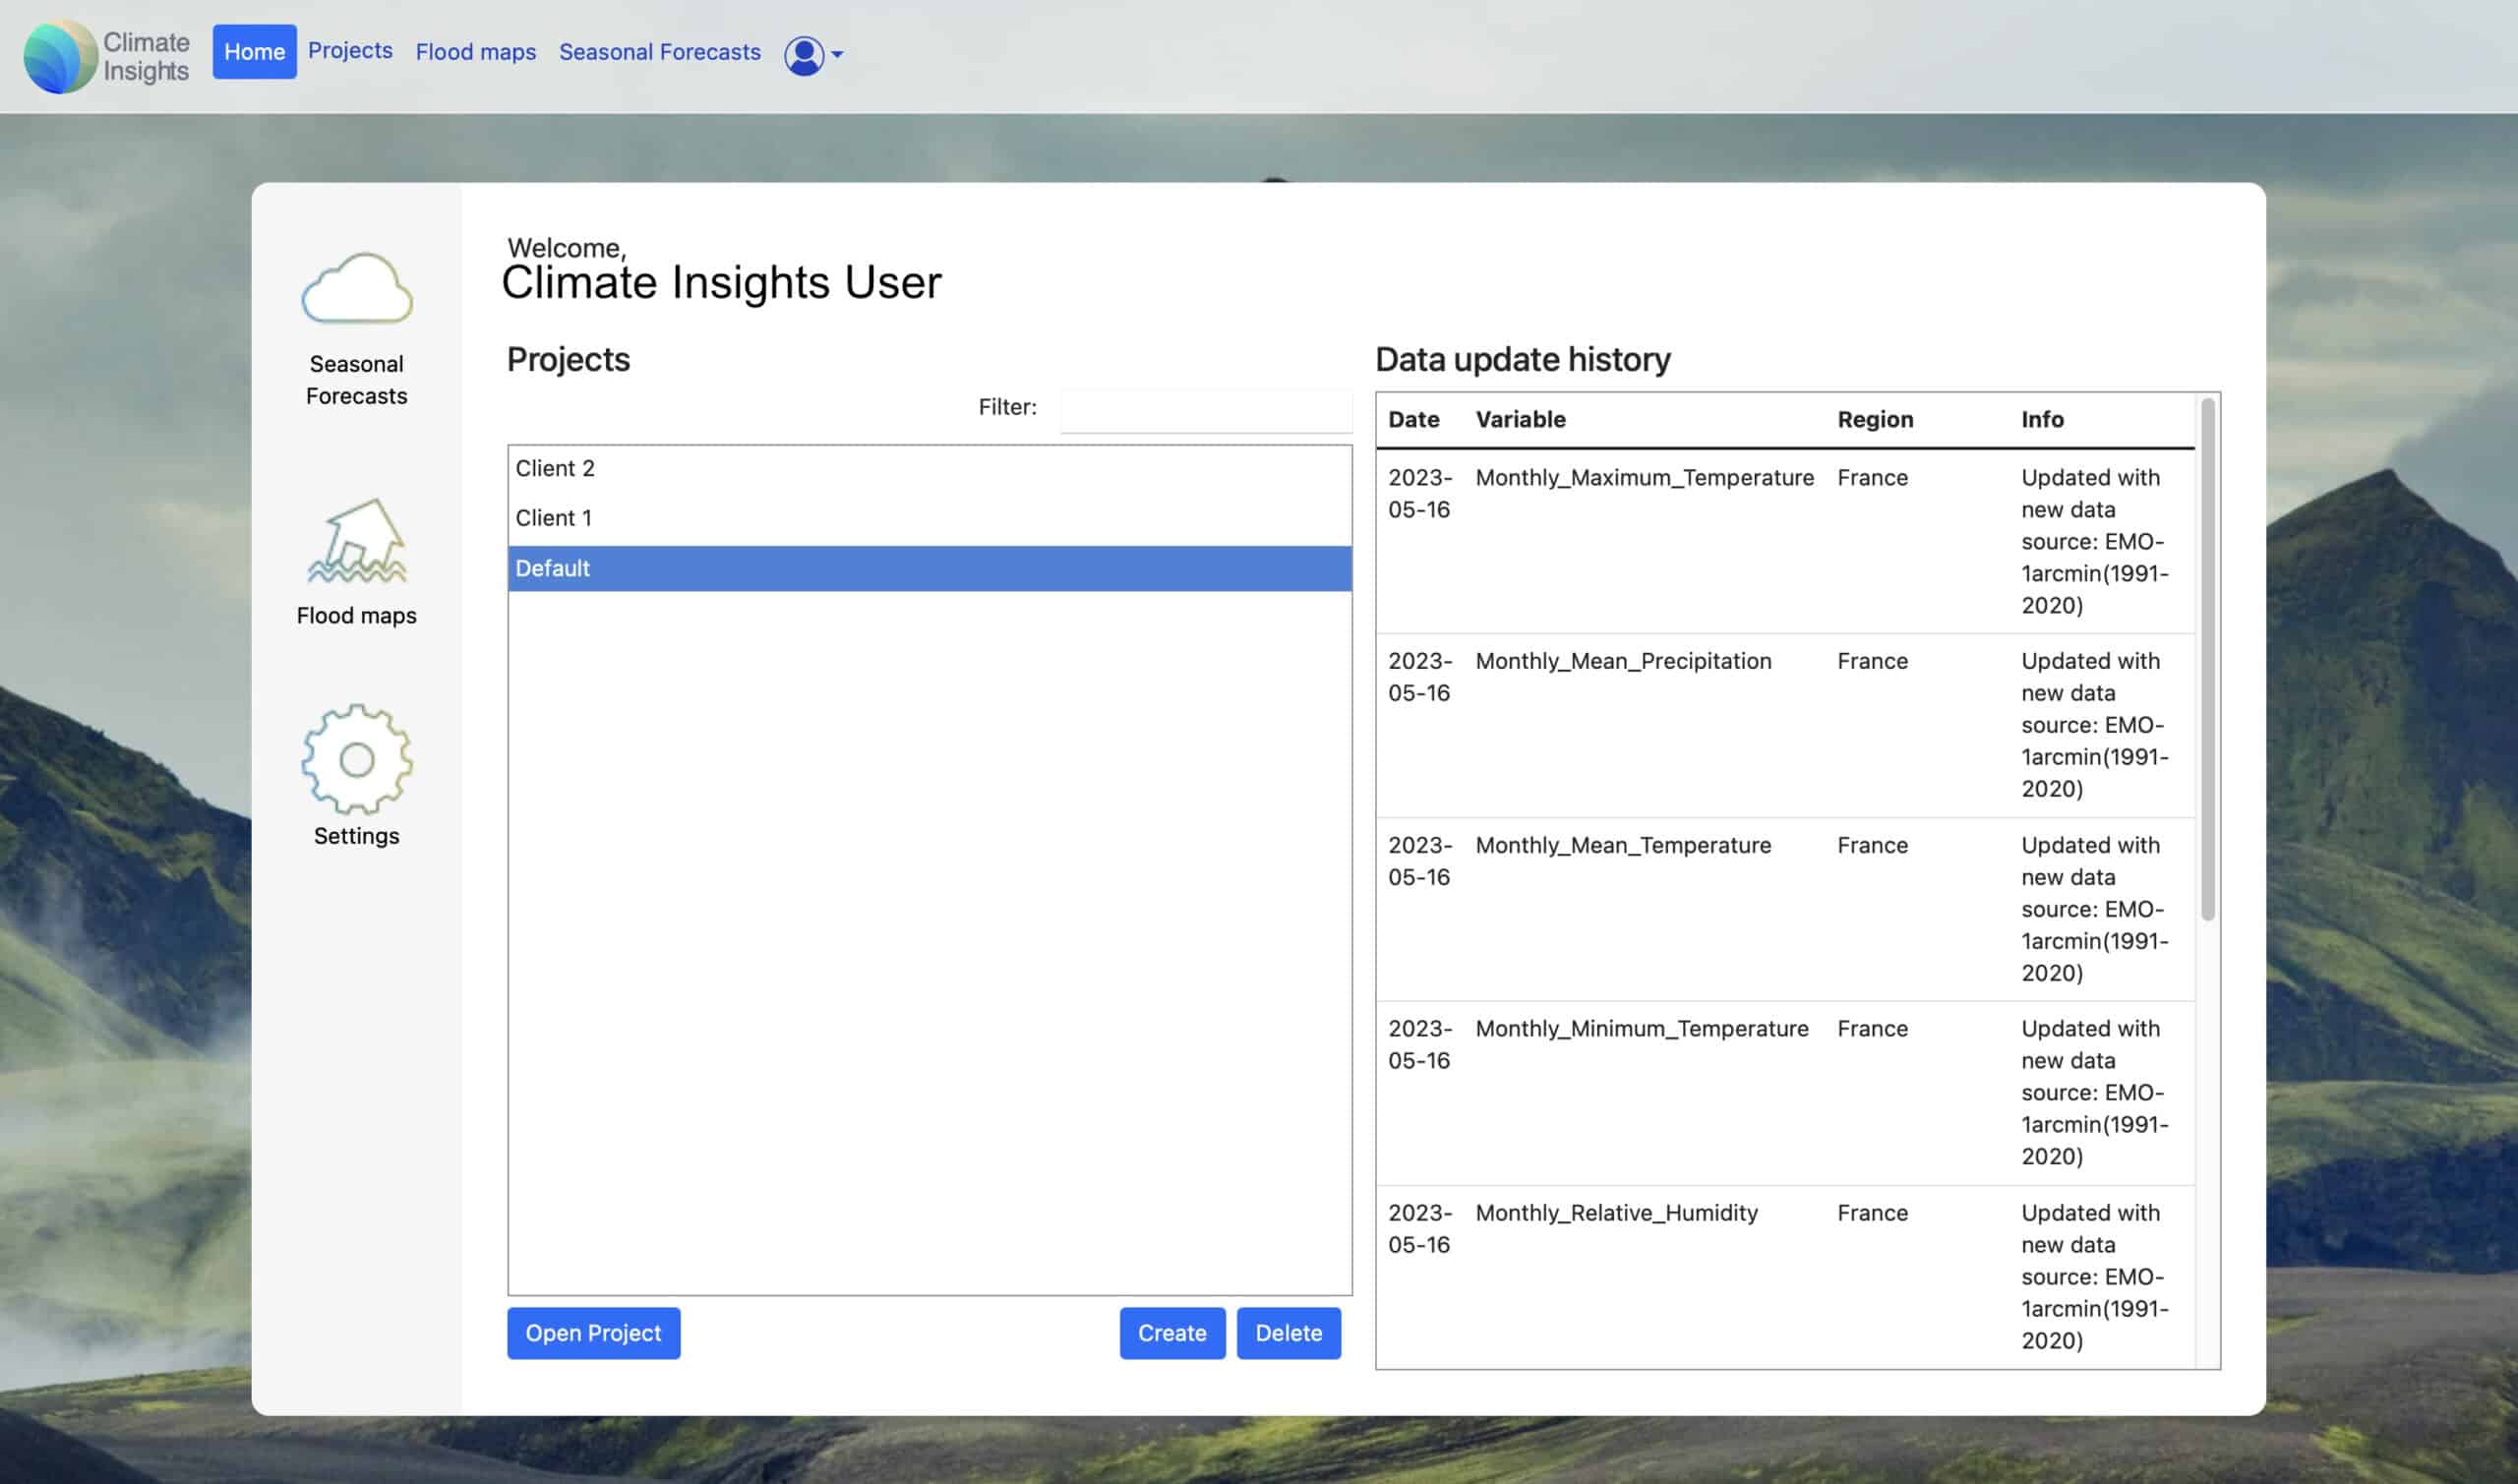
Climate Insights Welcome
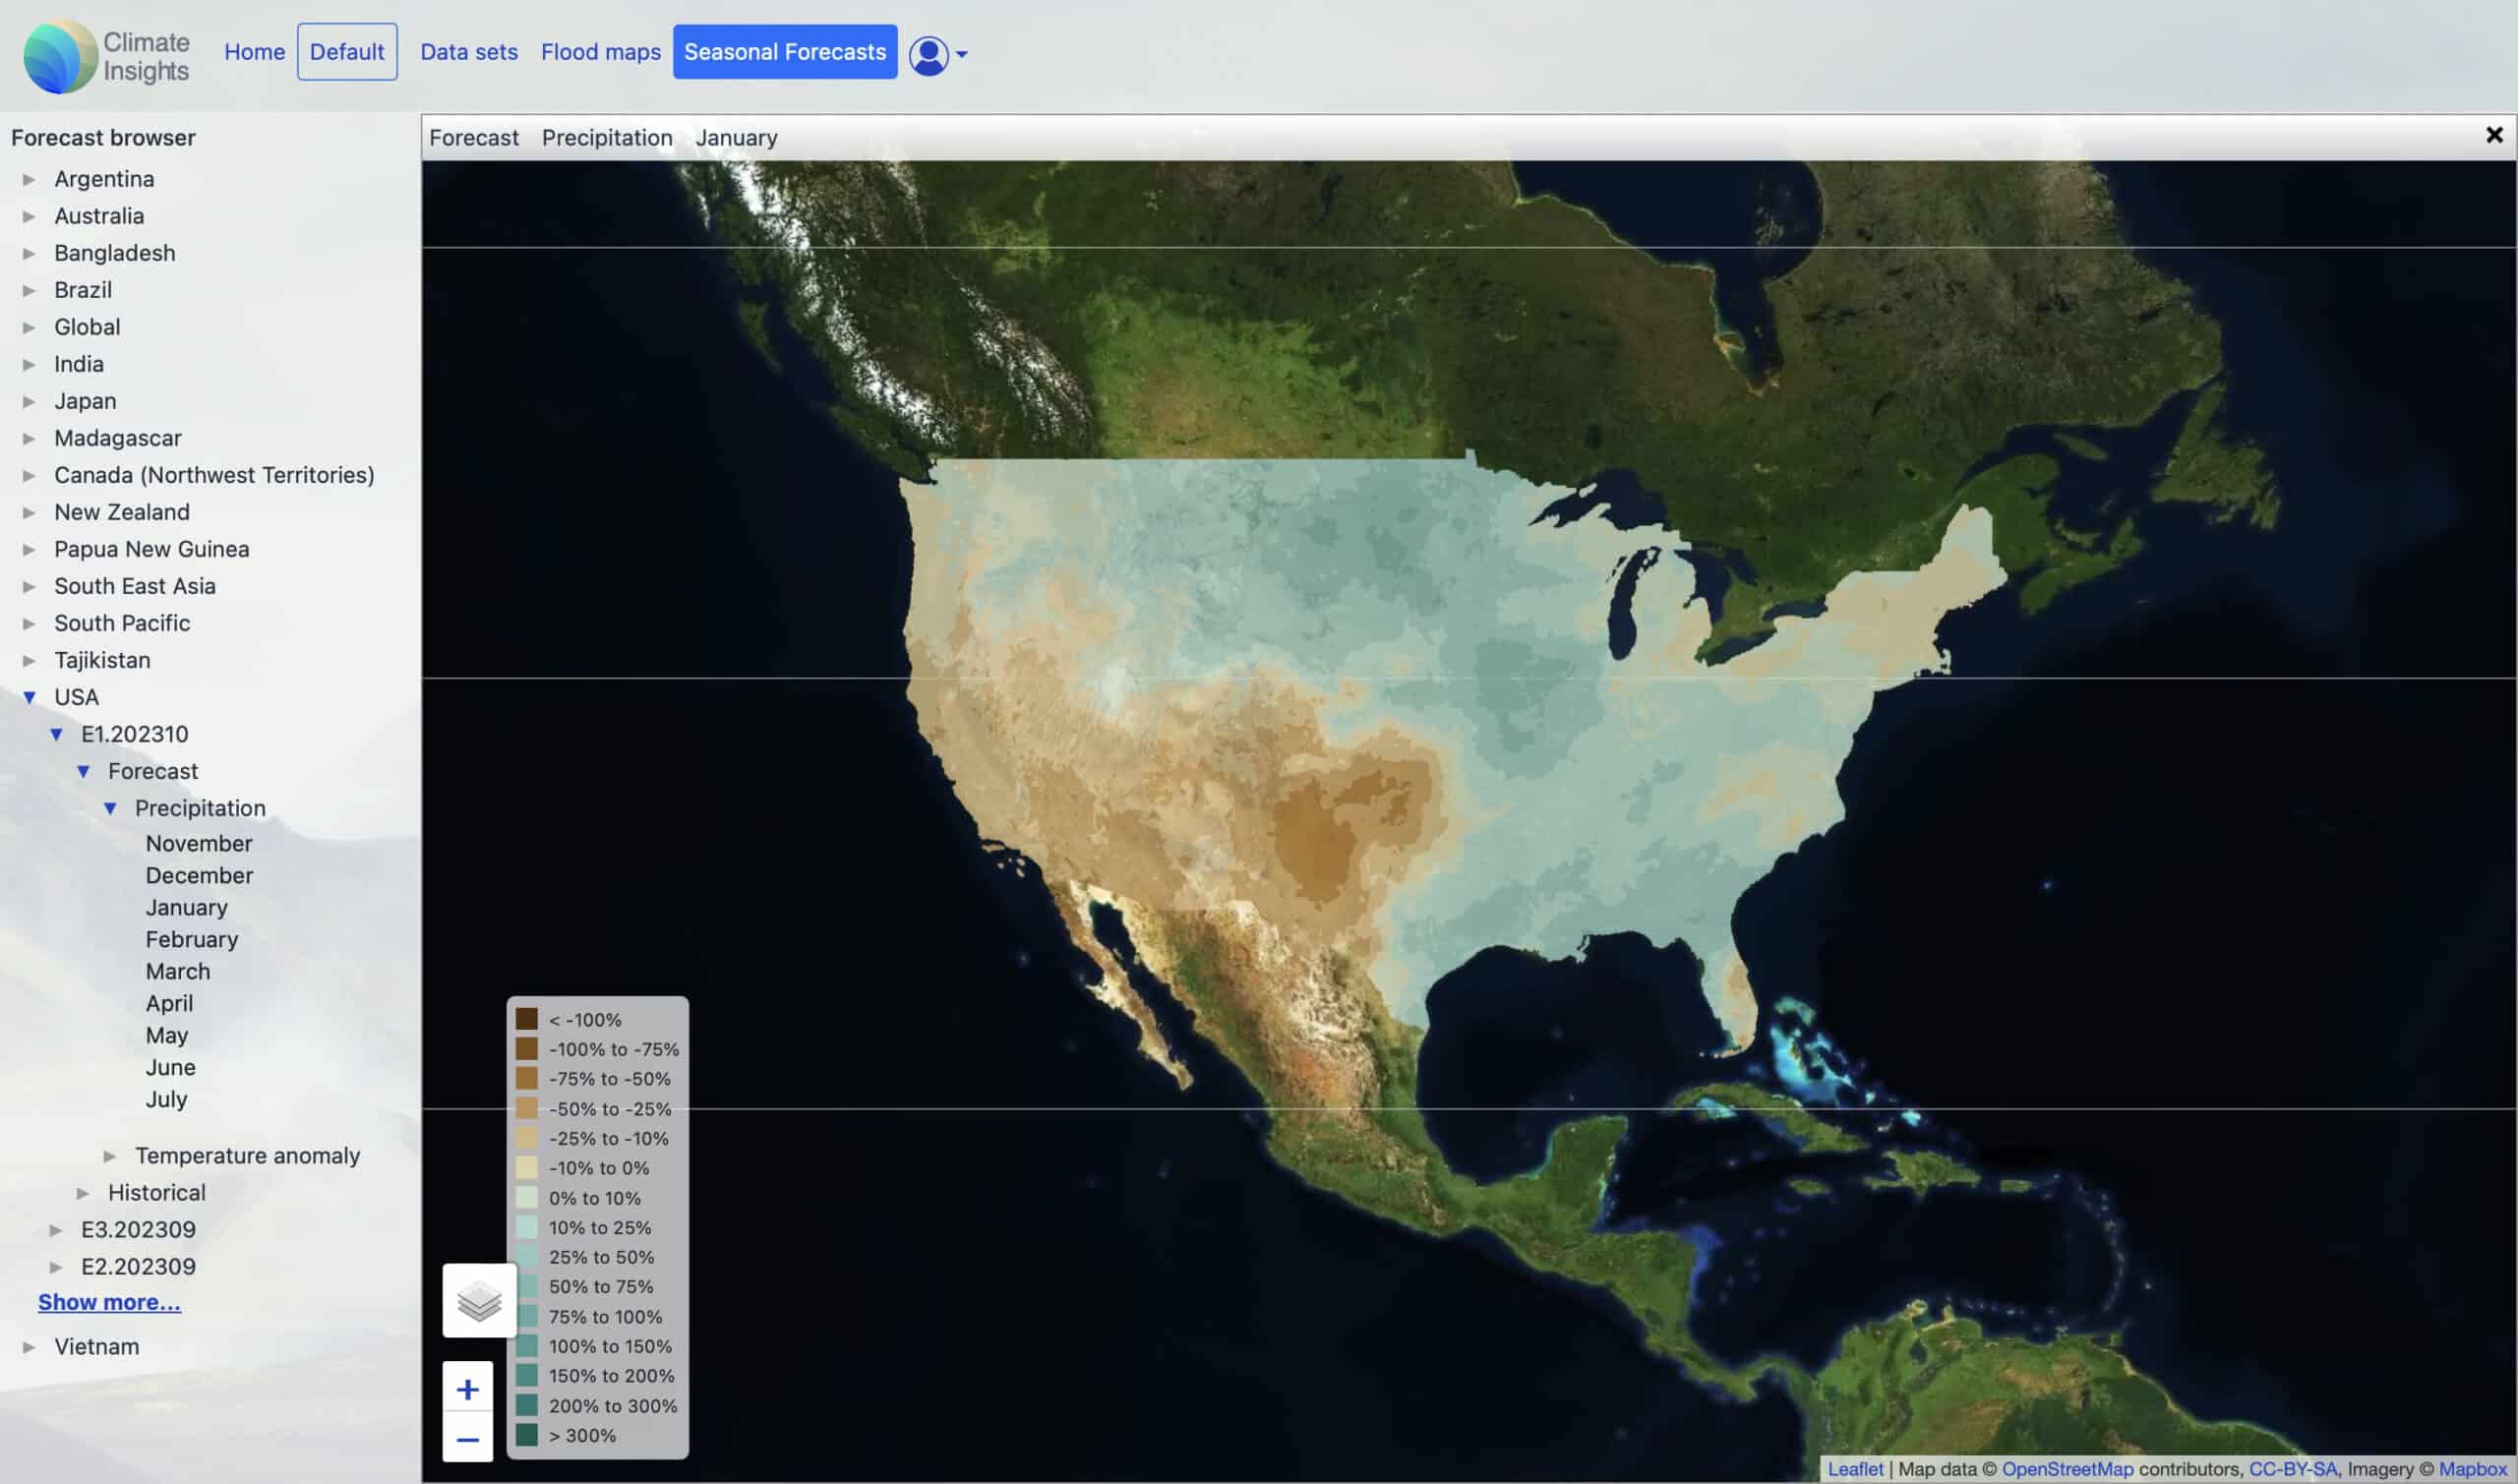
Climate Insights Forecast
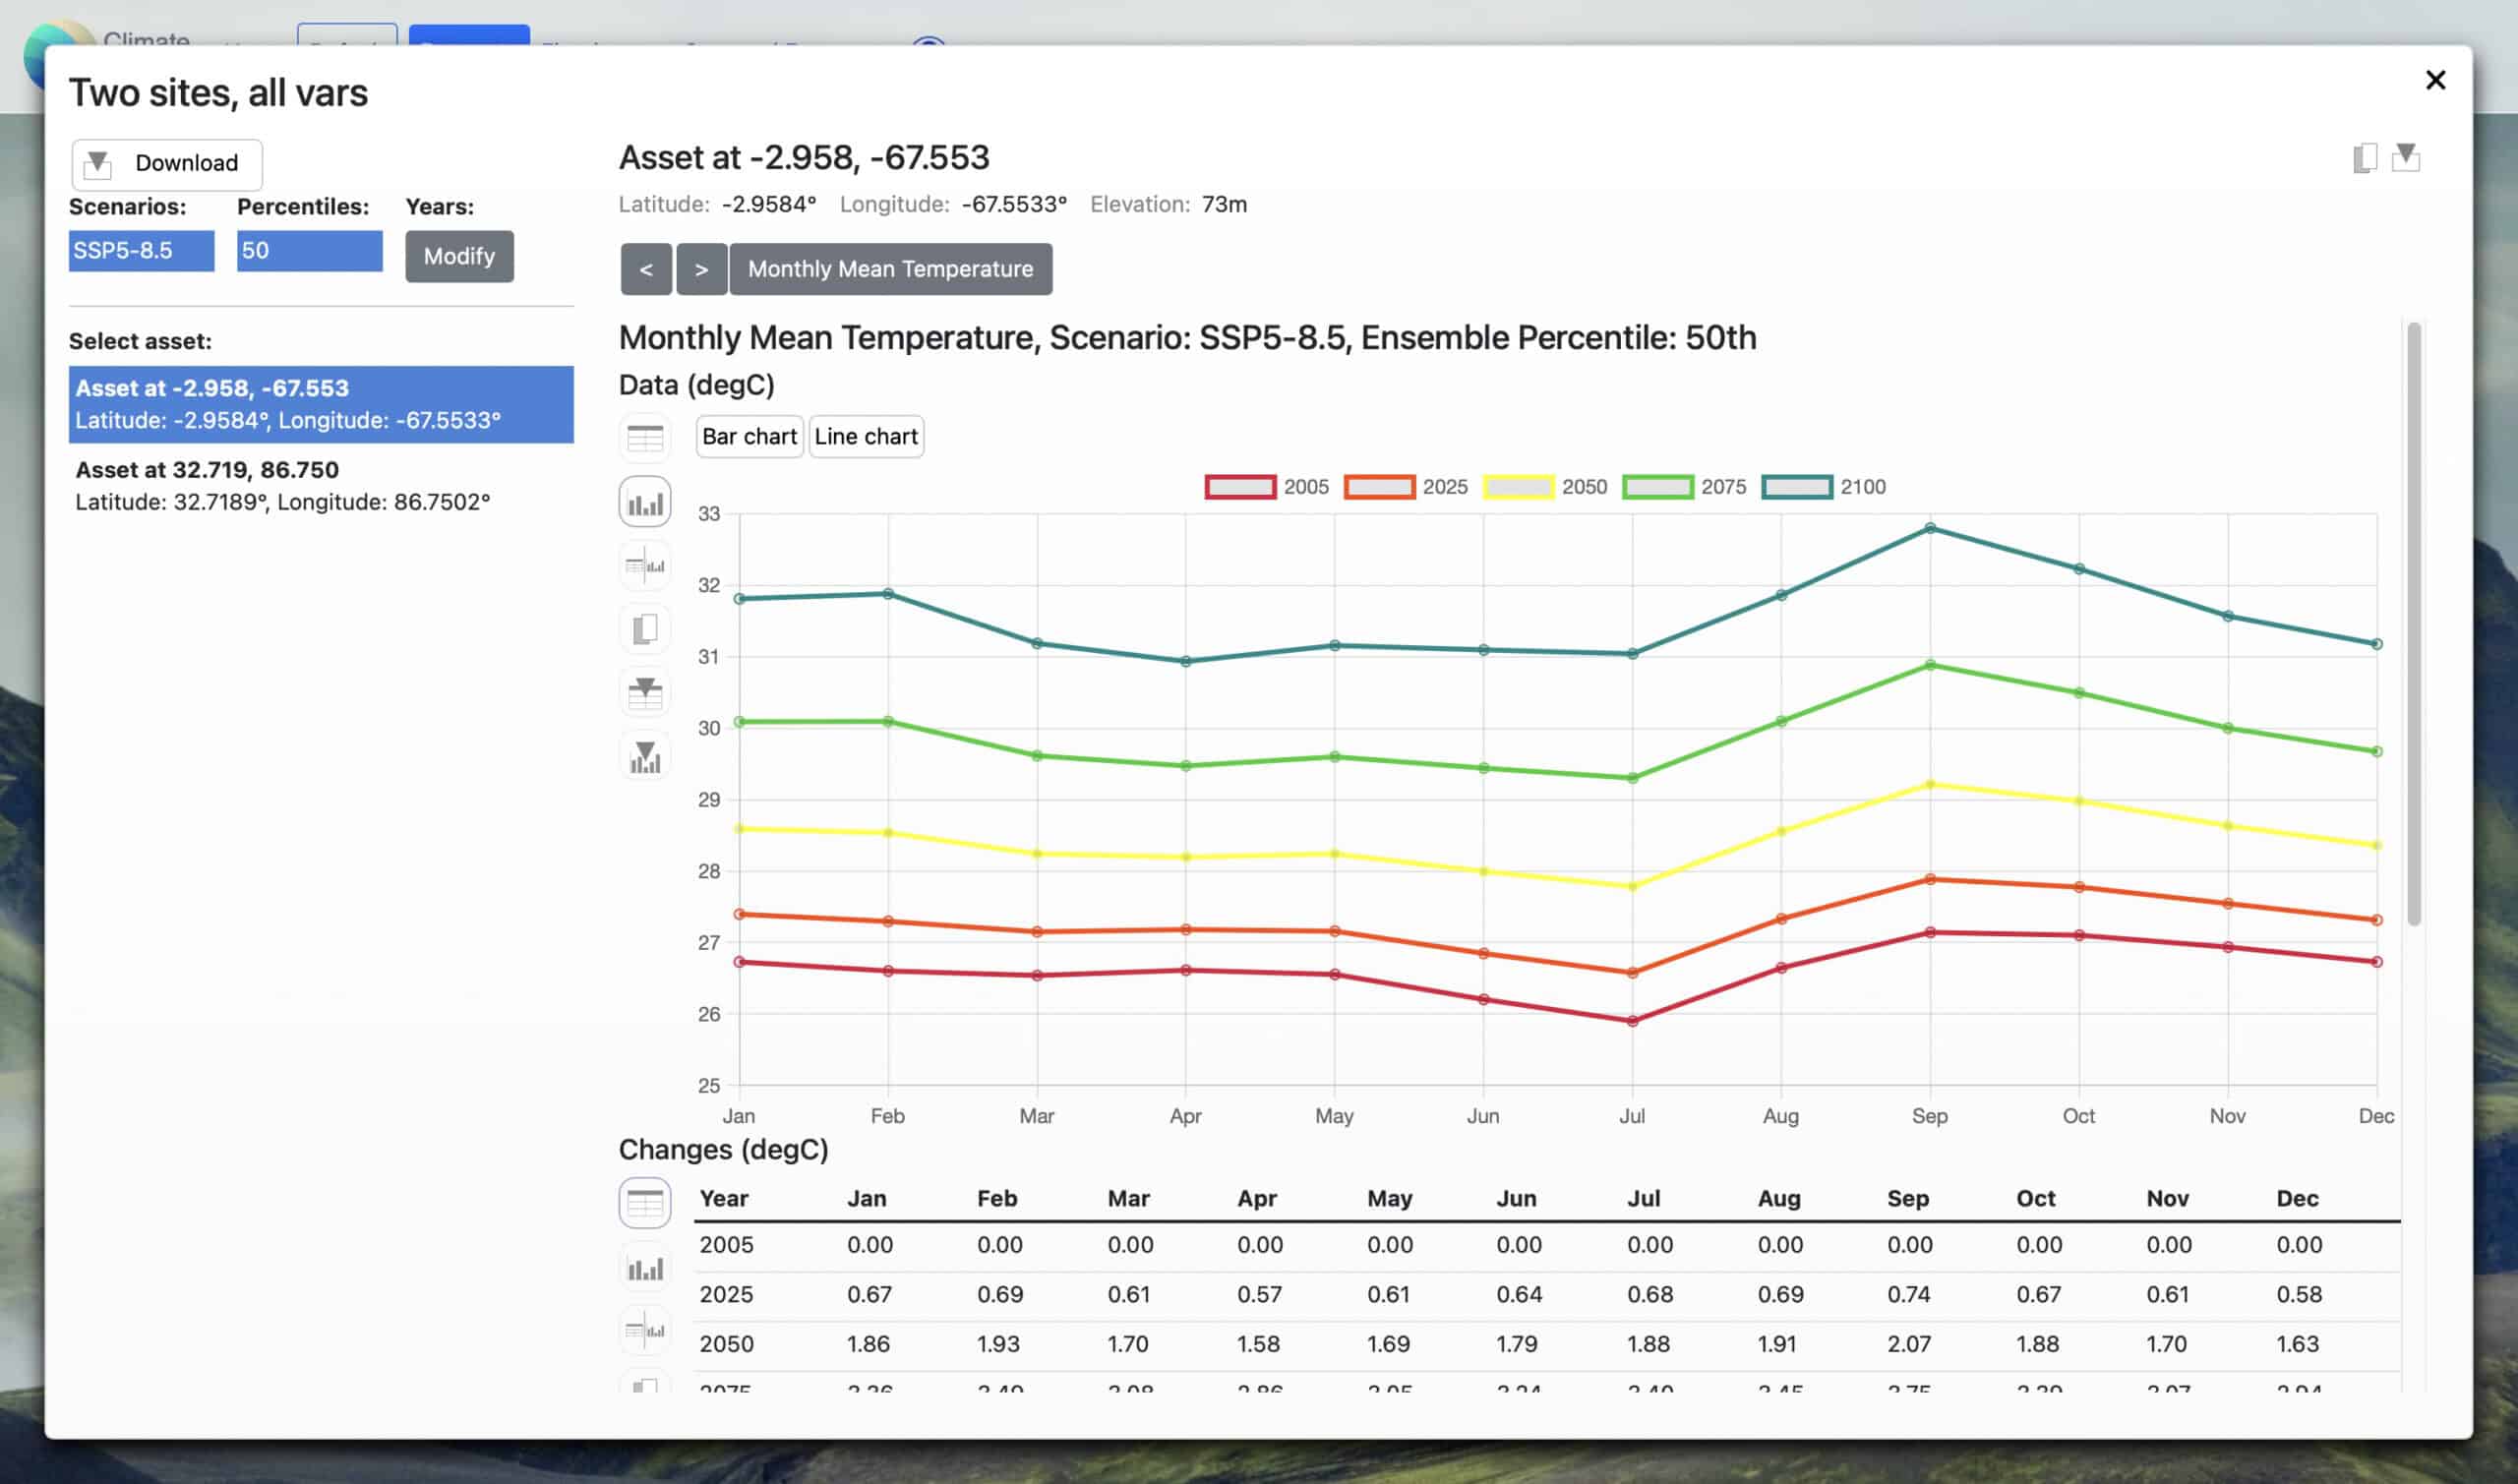
Climate Insights Data
Frequently asked questions
Find answers to specific Climate Insights questions
Whats the difference between a localised and non-localised asset?
Localised assets are assets at a specific location that can be represented by a single latitude/longitude coordinate (or street address). Examples include warehouses, airports, factories. Non-localised assets are not at a specific location, are sometimes called ‘linear assets’ and are typically defined by a linear set of coordinates or spatial regions. Examples include railroads, powerlines, roadways, plantations.
What is gridded data?
Gridded data is when a domain (e.g. atmosphere, land, ocean) is represented on a conceptual grid where each grid cell holds a climate variable (e.g. mean monthly temperature). Horizontal grids are the most common type of gridded data when talking about climate and data and can represent a specific layer in the domain (e.g. ground surface) or an averaged value over many layers. Gridded data is most commonly used for spatial assessments of climate hazards and their variability across regions and countries. We can provide gridded data for many climate metrics covering areas from a few square kilometers through to whole countries and continents.
What are linear assets?
Linear assets often occur along an elongated route, such as transport networks and power transmission lines.The physcial climate data and risks associated with linear assets often require a more sophisticated level of analysis using goespatial statistical techniques. We are highly experienced in these methods of analysis for climate and climate change related hazards. As Silver Partners with ESRI and as an ESRI innovation award winner we understand the application of climate information spatially.
Is your data compatible with TCFD reporting requirements?
Yes. Our data covers the IPCC SSP scenarios at five yearly increments out to 2100. We provide the 5th, 50th and 95th percentile data which allows uncertainty in the predicted climate to be quantified. Our climate metrics are extensive and cover chronic and acute hazards required by TCFD and the wide range of business domains disclosing under TCFD. A key goal of TCFD is to promote better disclosure of the financial implications of climate-related risks and opportunities. Our risk quantification model is ideally suited for this requirement and allows you to gain insight into the key elements of your business and business sector that impacts your financial performance. Quantification of climate-related risks and opportunities is carried out on a peril by peril and asset component by asset component basis for damage and productivity losses with adaptive capacity factored in.
Is your data compatible with framework proposed by the Taskforce on Nature-related Financial Disclosures?
Yes. Our data covers the IPCC SSP scenarios at five yearly increments out to 2100. We provide the 5th, 50th and 95th percentile data which allows uncertainty in the predicted climate to be quantified. Our climate metrics are extensive and cover chronic and acute hazards required by TNFD and the wide range of business domains disclosing under TNFD. A key goal of TCFD is to promote better disclosure of the nature-based implications of climate-related risks and opportunities. Our risk quantification model is ideally suited for this requirement and allows you to gain insight into the key nature-based elements of your business and business sector that impacts your financial performance. Quantification of climate-related risks and opportunities is carried out on a peril by peril and related nature-based and associated adaptive capacity basis.
Is your data compatible with the standards set by the Intergovernmental Panel on Climate Change?
Yes. Our data analysis and modelling methods are in line with IPCC protocols. Our data reflects the IPCC time slices and scenarios. We also follow IPCC protocols for super ensembles and sea level rise, for example. We are currently working with IPCC AR6 data and our staff are actively engaged in IPCC AR7 working groups.
There are a number of different levels of analysis talked about: portfolio screening, medium dive, deep dive etc. What level of analysis is your data suitable for or what level of analysis do you offer?
Our team are highly experienced in discussing and discovering the appropriate detail of data for analysis. We typically have discussions with our clients to discover the most suitable level of detail to future proof your investment in physical climate risk data. We recommend taking care when deciding what level of analysis to do, often it is not as clear cut as screening, medium or deep dive. When considering the level of analysis you should take into account the objectives of the data and analysis, where you are at on your climate risk and opportunities journey and how you intend to use the data and analysis.
What level of data and climate capability do I need to run a self-serve package like Foundation and Enterprise?
If you have the technical knowledge and capability to analyse and interpret climate data and are looking to obtain climate risk data around the globe as and when you need it to support your work, then a self-serve subscription could be right for you. If you do not have that capability we recommend considering one of our other data options, such as the valet report or engage our team to carry out the analysis with you. We are always happy to discuss your specific needs.
What is the difference between the 15 core metrics and the 60 metrics?
The core metrics are a collection of the most commonly used and generally applicable climate metrics used to support disclosures requiring physical climate risk assessments. Beyond the core metrics we offer a suite suite of additional metrics such as flooding and sectoral perils from our complete suite of 60+perils that provide more specific insights or finer resolution of data.
What if I'm interested in a metric or variable that I don't see in the 60+ list?
We can create custom metrics as part of our consulting business. Please contact us to discuss your requirements and see how we can help.
What scenarios do you offer?
As a world-leading supplier of actionable climate information, we have a range of output options available in the Climate Insights platform. Each analysis is customisable for the range of CMIP6 Shared Socioeconomic Pathways (SSPs): SSP1-1.9, SSP1-2.6, SSP2-4.5, SSP3-7.0 and SSP5-8.5. The time slices start from a baseline reference year of 2005 with five-year increments to 2100. Critically, Climate Insights offers the option of generating 5th, 50th and 95th percentile outputs from the super ensembles of GCM and RCM (when available) projections, which provides users with an excellent opportunity to discover the uncertainty range in climate variable outputs. For extremes such as rainfall and wind, return period outputs (ARI-annual return interval) cover a range of time slices and are recognised as best-practice approaches to physical climate risk assessment.
What climate models is the data based off?
Climate Insights strictly follows IPCC guidelines in data modelling and application. For any specific climate risk analysis, we always adopt peer-reviewed methods. All algorithms and data sets used in modelling are thoroughly documented and traceable. Again, the vast experience our experts have gained over the years means that what is available in Climate Insights is thoroughly tested and has been extensively peer-reviewed, not only by our Scientific Advisory Panel but through external professional reviews.
What is the difference between Climate Insights and SimClim?
Climate Insights is our flagship climate risk assessment tool driven off our Climate Insights Database and enables you to understand the site-specific projected impacts of acute and slow-onset climate change for your assets or operations. Climate Insights can be accessed through either a self-serve or valet subscription. With the self-serve option, you get access through a web app to point location data for 60+ variables at monthly or higher temporal resolution. The data can be downloaded for multiple sites or accessed through an API. A valet subscription offers access to a physical climate change risk report and digital files of the associated data. SimClim is a stand-alone modelling system designed to facilitate the assessment of risks from climate change, integrating the latest scientific projections of future climate changes for teaching, research and education purposes. The desktop (windows OS) application gives access to spatially gridded data of seven key climate metrics at monthly temporal resolution, including mean, max and min temperatures, precipitation, wind speed, solar radiation and relative humidity in data packs on a country basis. The desktop app also provides a number of analysis tools, including scenario generation, timeseries data exploration, extreme event analysis, rain water tank modelling, water balances, coastal erosion, and degree days.
When should I do custom consulting vs Climate Insights subscription?
If you have a experienced climate team that is familiar with utilising climate data and you are looking for point location climate data, you can use a Climate Insights subscription to extract your own data for a more detailed analysis. If you have an experienced climate team that is familiar with utilising climate data and you are looking for spatially gridded climate data, contact us to discuss obtaining access to our gridded climate data for the variables you are interested in. If you don’t know where to start, custom consulting provides significantly more detailed analysis for those outside the climate and sustainability fields.